WAS THIS PAGE HELPFUL? Leave Feedback
Overview
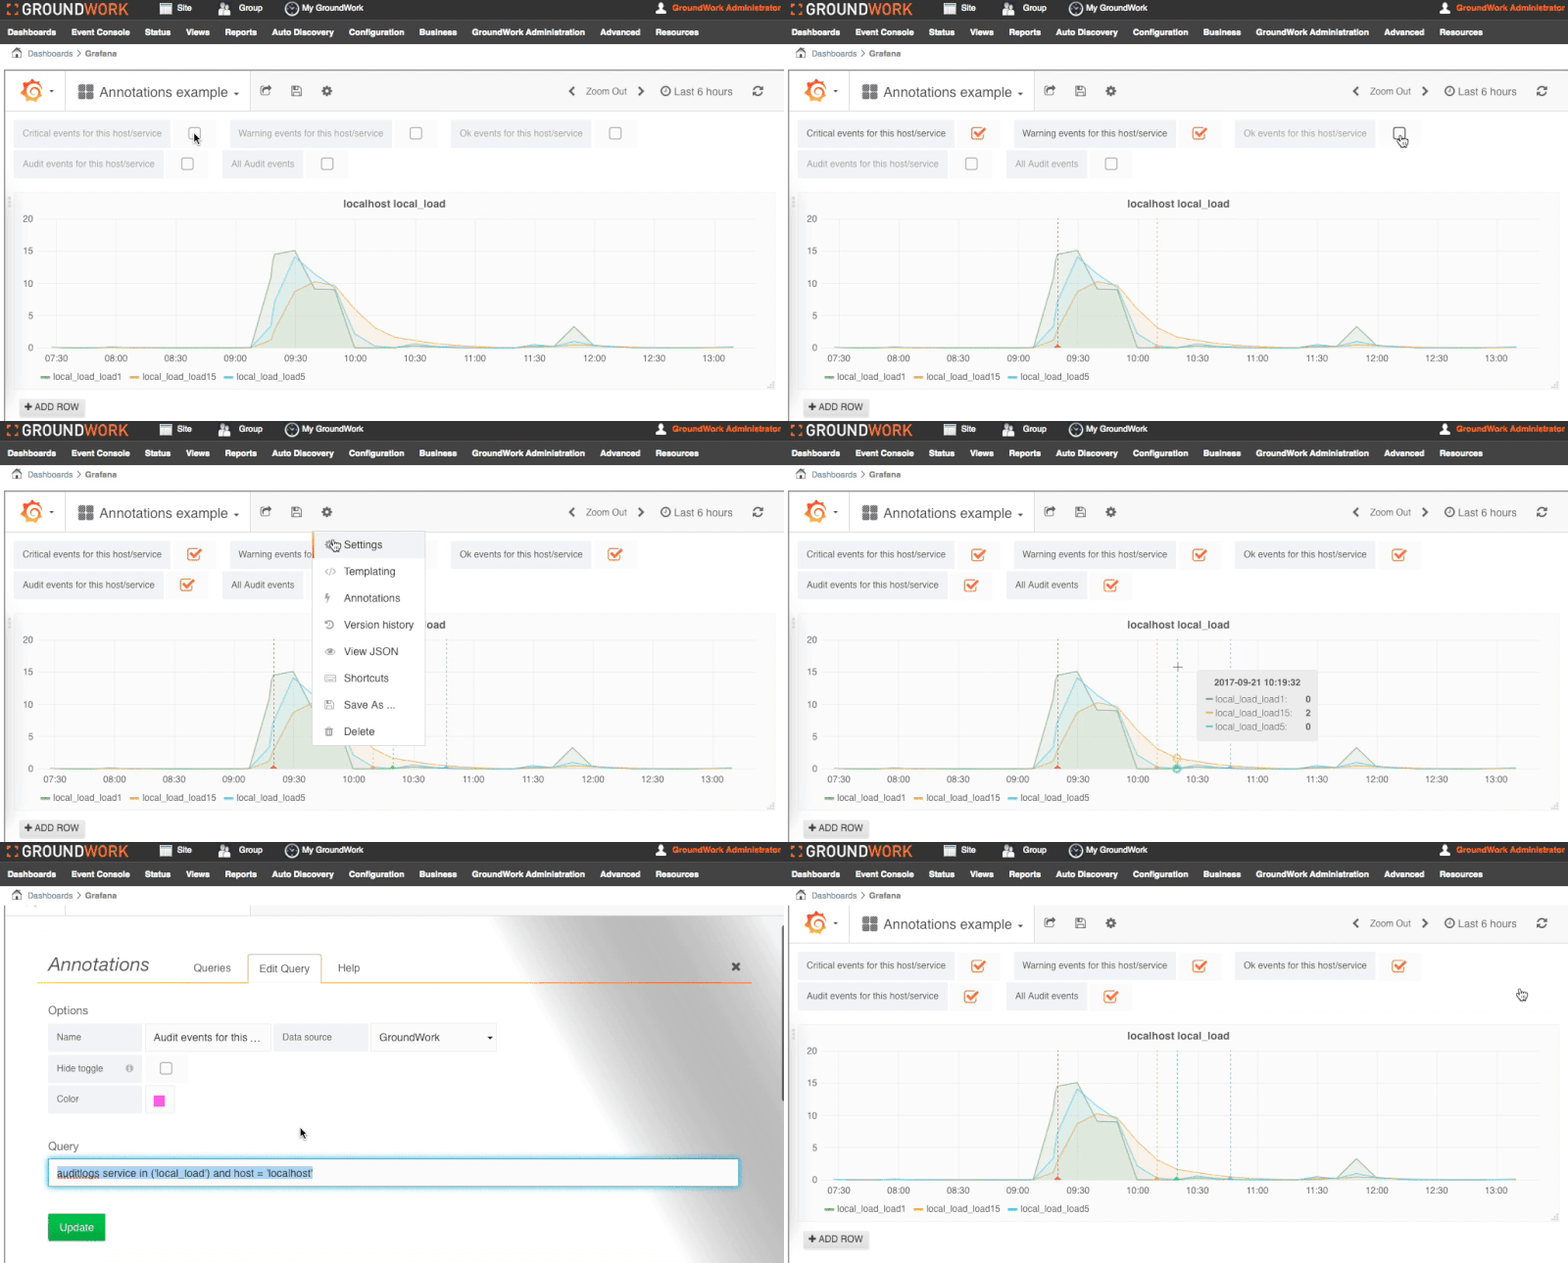
GroundWork events and audit log entries can be added to Grafana graphs as annotations. They are automatically included in Grafana graphs that are embedded in Status. An example annotations dashboard is provided and is called Annotations example. This video demonstrates the different types of annotations that are available using the example dashboard provided and how the annotations are defined.

Service Event Annotation Queries
Service event annotation queries are GroundWork REST API /api/events queries.
For example, if the annotation Query is set to severity='CRITICAL' and service in ('local_load') and host = 'localhost', this is passed to /api/events, and would return all events of critical severity for local_load on localhost, for the time range selected in the graph. If the annotation Query is set to just severity='CRITICAL', then all critical events would be returned for the selected time range.
More information about /api/events queries can be found in the API documentation, see Event APIs.
Audit Log Annotation Queries
Audit log annotation queries are GroundWork REST API /api/audit queries. To distinguish these these from service event queries, the word auditlog starts the query.
For example, auditlogs service in ('local_load') and host = 'localhost', returns all audit log entries for service local_load on host localhost for the time range selected in the graph. Specifying just auditlogs in the query will return all audit log entries for the selected time range.
More information about /api/audit queries can be found in the API documentation, see Audit Log APIs.
