
GroundWork Monitor Demo
Enterprise Login Screen
A sample custom dashboard that includes the 'Seurat' whole infrastructure view
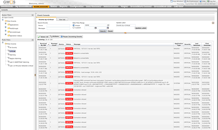
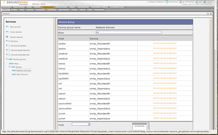
A filtered event console view showing all recent critical events
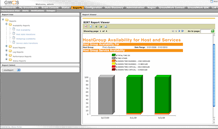
Correlating availability and performance information in the Status Viewer
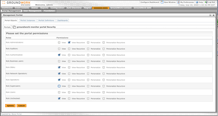
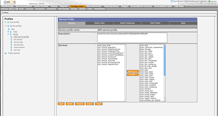
Configuring groups of related services in the Configuration tool
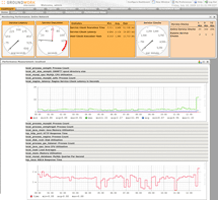
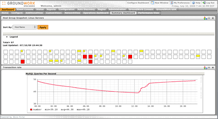
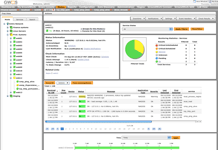
Example dashboard showing monitoring statistics and two key performance measures
Availability reports with HTML and PDF output options
User and role based permissions
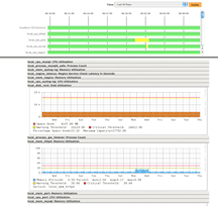
The server detail screen (Enterprise edition) combines availability, performance and recent event details on a single screen
Point-and-click creation of best practice monitoring profiles


