[NOTE] Your version of Internet Explorer is incompatible with the advanced features of this site. Please download the latest Internet Explorer or Firefox.
Enterprise Quickstart
Trial
$49 - 299
per year
Monitor Enterprise 6.3 software
Monitor up to 50 devices
Email support for first 60-days
Self-paced, online training included

Step 2: Configure

Step 3: Buy

$49

Enterprise Flex Program
Starting at
$2000
per year
Monitor Enterprise 6.3 software
Product updates, patches included
Priced per monitored device
Selection of support levels to meet your needs

Step 2: Configure


Minimum device quatity for Flex 1-3 is 50. Flex 4 minimum is 1000

Step 3: Buy

$4500

Complete Monitoring Coverage with Enterprise Edition

Add more facts and get more value out of your operational dashboard by leveraging real-time availability and performance information into asset and inventory management, ticketing systems and configuration to provisioning systems.

Enterprise is Interoperable

Enterprise Edition provides excellent availability and performance visualization. The included portal provides a access to existing IT operations tools from 3rd-party monitoring and reporting through CMDBs, ticketing, asset and configuration management systems.

Manage all monitors with Enterprise

Enterprise Edition accepts data from agents, 3rd party monitors, scripts and existing plug-ins. The correlation engine applies service dependencies, de-duplication and thresholds to performance and availability data - resulting in high-quality events and alarms.

Enterprise handles virtualization and the cloud

Enterprise Edition provides OS, middleware, application and end-user measurement and monitoring for all environments and operating systems.

Enterprise Login Screen
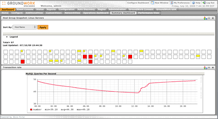
A sample custom dashboard that includes the 'Seurat' whole infrastructure view
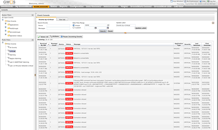
A filtered event console view showing all recent critical events
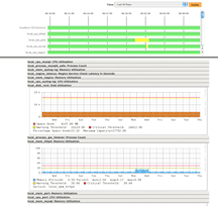
Correlating availability and performance information in the Status Viewer
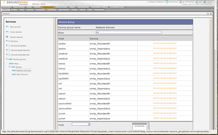
Configuring groups of related services in the Configuration tool
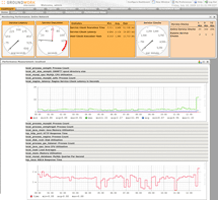
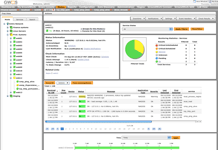
Example dashboard showing monitoring statistics and two key peformance measures
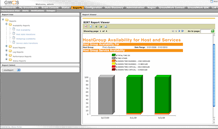
Availbility report with HTML and PDF output options
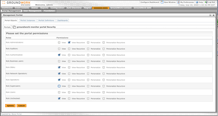
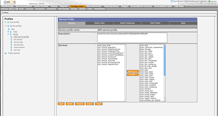
User and role base permissions
The server detail screen (Enterprise edition) combines availability, performance and recent event details on a single screen
Point-and-click creation of best practice monitoring profiles

Enterprise Edition Monitoring Gives Complete IT Coverage

Get a pervasive system to cover everything that your business relies on. Over 1500 plugins are available to monitor IT systems, devices and applications. Over 75 profiles are exclusively included in Enterprise Edition, some of the more popular ones are listed below.

Applications
  • Blackberry
  • Enterprise Server
  • Citrix
  • Groundwork Monitor
  • Tomcat
  • JMX
  • Application Servers
Web Services
  • Apache
  • Web Servers
  • MSFT IIS
  • Generic HTTP/ HTTPS
Databases
  • Oracle
  • MSFT SQL
  • Server
  • MySQL
Operating Systems
  • AIX
  • HP-UX
  • Generic SNMP
  • SNMP Traps
  • Syslog
  • VMWare ESX
  • Windows Desktop Oss
  • Windows Server
  • Windows Domain Controller
Network Devices
  • DNS
  • Named
  • Mail (SNMP)
  • Mail (POP3)
  • Mail (IMAP)
  • MSFT Exchange
  • MSFT Exchange Anti-Virus
  • Liveness (Ping)
  • FTP
  • LDAP

Expand the Enterprise Edition's productivity with these Add-Ons

Our biggest advantage is permitting you to control how enterprise wide monitoring works best.

GC Inventory
Asset manager extension $8,000.00
NagVis Visualization Package
Enhanced dashboards and reports $3,000.00
CanIt-SPE Anti-Spam
Anti-spam protection Request a Quote
Cloud Management
Manage your cloud infrastructure Request a Quote
DassMonarch SOAP
Perl API and SOAP Interface $4,000.00
Enterprise Quickstart + Zendesk Connector
Combined ticketing and monitoring $299.00
BMC Patrol Enterprise Manager
Integrates GWMEE with BMC PEM Request a Quote
IBM Tivoli Enterprise Console
Integrates GWMEE with IBM Tivoli Request a Quote
BMC Remedy Service Pack
Integrates GWMEE with BMC Service Desk Request a Quote
BMC Service Desk Express
Integrates GWMEE with Service Desk Express Request a Quote

Enterprise Login Screen

A sample custom dashboard that includes the 'Seurat' whole infrastructure view

A filtered event console view showing all recent critical events

Correlating availability and performance information in the Status Viewer

Configuring groups of related services in the Configuration tool

Example dashboard showing monitoring statistics and two key peformance measures

Availbility report with HTML and PDF output options

User and role base permissions

The server detail screen (Enterprise edition) combines availability, performance and recent event details on a single screen

Point-and-click creation of best practice monitoring profiles

Visualize all monitoring with Enterprise

Enterprise encompasses virtualization and the cloud

Enterprise is Flexible

* Nagios is a registered trademark of Nagios Enterprises